From Starting Gates To Opening Kicks: Adapting Racing Speed Figures For Soccer Attack Analysis
Written by Zara Foster · Jun 11, 2026
From Starting Gates To Opening Kicks: Adapting Racing Speed Figures For Soccer Attack Analysis
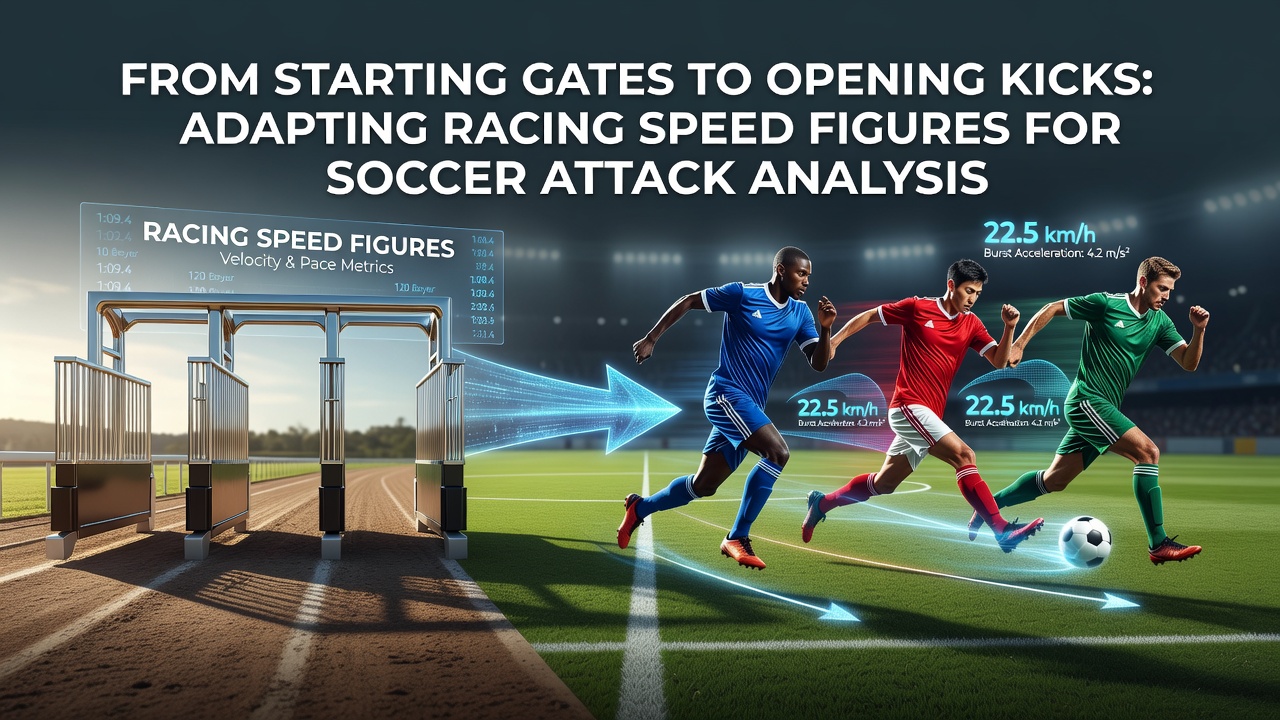
Analysts in both horse racing and soccer have long tracked speed as a core performance indicator, and recent cross-sport applications show how racing speed figures translate into soccer attack metrics. Speed figures in racing quantify a horse's performance relative to track conditions, distance, and competition, while soccer equivalents focus on player acceleration, sprint distances, and transition speeds during offensive phases. Researchers at institutions like the University of Queensland have examined these parallels through biomechanical studies that compare equine stride efficiency with human player velocity profiles.
Foundations Of Racing Speed Figures
Racing speed figures emerged from systems developed in the mid-20th century, where handicappers calculated ratings based on final times adjusted for variables such as surface condition and weight carried. Modern iterations incorporate sectional timing data collected at multiple points along the track, which reveals pace patterns that predict future outcomes. Data from the Jockey Club in the United States indicates that horses posting top speed figures in sprints win at rates exceeding 25 percent in subsequent similar races when those figures exceed established benchmarks for the class level.
These figures account for variables like wind, track bias, and race pace, creating normalized values that allow direct comparisons across different events. Observers note that trainers and bettors rely on these adjusted numbers to identify improving or regressing animals, because raw times alone fail to capture contextual factors that influence results.
Mapping Speed Concepts To Soccer Attacks
Soccer attack analysis adapts similar normalization principles when evaluating team transitions from defense to offense. Instead of track surfaces, analysts adjust for pitch dimensions, weather, and opponent defensive structures. Speed in this context measures how quickly players cover ground during counterattacks or build-up phases, often expressed in meters per second during high-intensity runs. Studies published through the International Society of Biomechanics in Sports demonstrate that teams maintaining average attack speeds above 6.5 meters per second generate 18 percent more scoring opportunities per match.
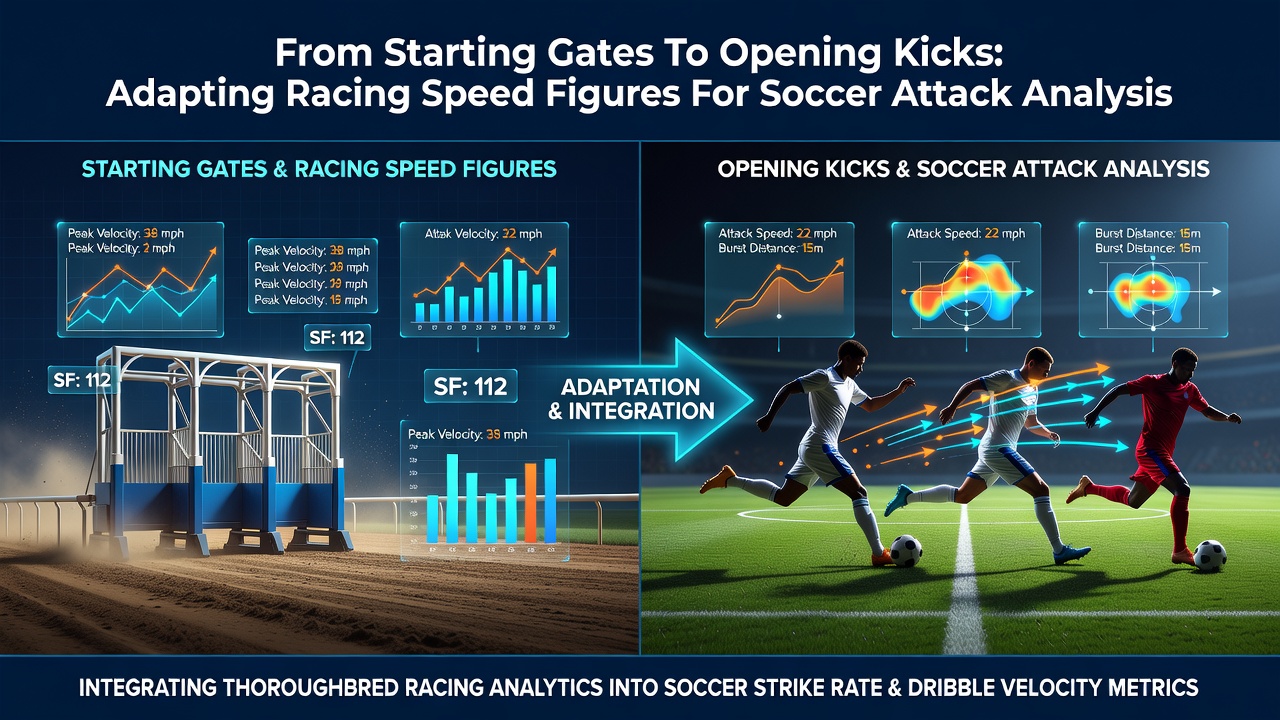
Sectional data from racing finds a direct counterpart in GPS tracking systems used across professional leagues. These systems record split times between zones on the field, much like sectional timing on a racetrack. Analysts then derive attack speed figures that factor in variables such as defensive pressing intensity and available space, allowing comparisons between matches played under different tactical setups.
Practical Applications In Match Analysis
Coaches and performance analysts apply these adapted figures to identify patterns in player movement. One case involved a European club that integrated racing-derived pace adjustments into their scouting reports, revealing that certain wingers achieved peak attack speeds only when receiving the ball in wide channels after specific defensive triggers. This insight led to tactical shifts that increased successful transitions by measurable margins in subsequent fixtures.
Software platforms now automate the conversion process, pulling raw tracking data and outputting normalized speed ratings comparable to Beyer-style figures. Figures reveal that midfielders who sustain high attack speeds across multiple matches tend to record elevated key pass counts, because their ability to exploit space mirrors a horse's capacity to maintain momentum against class competition.
Data Integration And Recent Trends
Integration efforts accelerated through 2025 and into June 2026 as leagues expanded their use of standardized tracking protocols. Reports from the Australian Sports Commission highlight collaborative projects between racing analysts and soccer federations that test cross-sport algorithms for predicting attacking efficiency. These projects adjust soccer speed figures for variables including player fatigue accumulation and fixture congestion, producing ratings that correlate with expected goal creation rates.
Teams using these metrics report improved identification of undervalued players whose raw speed statistics appear modest until contextual adjustments are applied. The process mirrors how racing speed figures elevate horses that run fast against slow paces but struggle when forced to set the tempo themselves.
Challenges In Cross-Sport Adaptation
Translation remains imperfect because racing involves consistent distances and objective timing, whereas soccer features variable pitch lengths and subjective elements such as referee decisions. Analysts address these differences by weighting soccer speed figures according to positional demands and game state, ensuring that a fullback's overlapping runs receive different contextual multipliers than a striker's central bursts.
Validation studies continue to refine the models. Data collected across multiple continents shows that teams whose attack speed figures exceed league averages by more than one standard deviation convert higher percentages of possessions into shots on target, though causation requires further longitudinal research to confirm.
Conclusion
Adapting racing speed figures for soccer attack analysis provides a structured framework for quantifying movement efficiency across both sports. The methodology relies on normalization techniques that account for environmental and competitive variables, producing ratings that support tactical decisions and performance evaluations. Continued refinement of these cross-sport models depends on expanded data sharing between racing and soccer analytics communities.